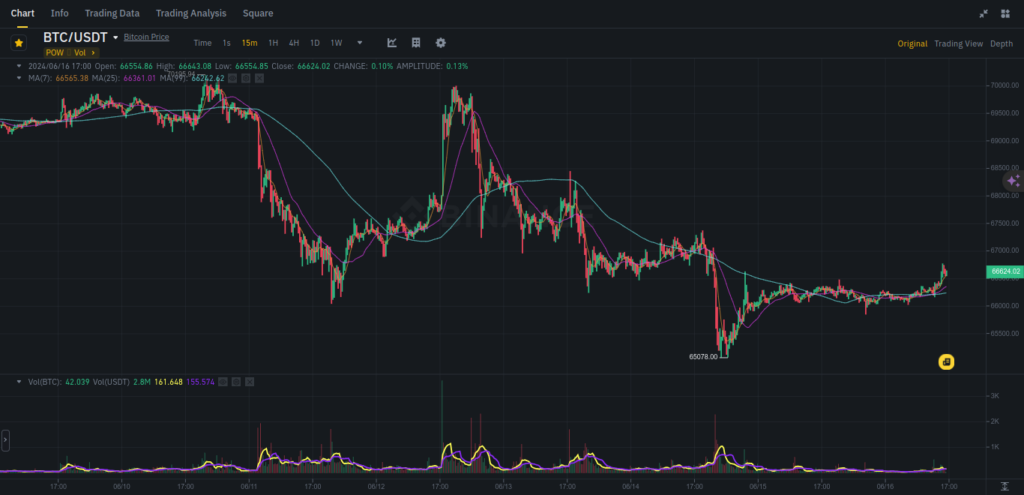
Bitcoin (BTC) has shown significant activity in recent trading sessions, presenting both challenges and opportunities for traders
- Current Price: 66,624.02 USDT
- Time Frame: 15-Minute
- Date: June 16, 2024
- Volume: 42.039 BTC (2.8M USDT)
Key Indicators
- Moving Averages:
- MA(7): 66,556.35
- MA(25): 66,361.01
- MA(99): 66,272.62
- Volume:
- Recent significant spikes in volume on June 11 and June 13, with a noticeable drop on June 14.
Technical Patterns
- Recent Trend: The chart shows a significant decline starting from June 11, reaching a low at 65,078 USDT, followed by a recovery phase.
- Support and Resistance Levels:
- Support: 65,078 USDT (recent low)
- Resistance: Around 67,000 USDT (multiple testing points)
- Moving Average Crossovers:
- The MA(7) is crossing above MA(25), indicating a short-term bullish momentum.
- The MA(99) remains above the shorter-term MAs, suggesting an overall bearish trend in the longer term.
Candlestick Analysis
- Bullish Reversal: The recent candlesticks show bullish reversal patterns, with strong green candles and higher closes compared to previous lows.
- Bearish Momentum: Prior to the reversal, the candlesticks show extended periods of bearish momentum, characterized by long red candles and lower lows.
Bull and Bear Case
Bull Case
- Short-Term: The bullish crossover of MA(7) and MA(25), along with increasing volume and recent higher lows, suggests a potential short-term uptrend. Target price: 67,000 – 68,000 USDT.
- Medium-Term: Sustained recovery above 67,000 USDT with increased volume could signal a continuation of the uptrend. Target price: 70,000 USDT.
- Long-Term: Breaking above the 70,000 USDT resistance with strong volume could signal the end of the overall bearish trend, aiming for higher highs.
Bear Case
- Short-Term: Failure to break above 67,000 USDT resistance, with decreasing volume, may lead to another downtrend. Target price: 65,000 USDT.
- Medium-Term: A breakdown below 65,078 USDT support could trigger further declines. Target price: 64,000 USDT.
- Long-Term: Continued bearish momentum with lower lows and failure to recover could result in a prolonged bear market. Target price: below 64,000 USDT.
Conclusion
Based on the current analysis, the BTC/USDT pair is showing signs of short-term bullish momentum, but it remains in a longer-term bearish trend. Traders should watch the key resistance at 67,000 USDT and support at 65,078 USDT for potential breakout or breakdown scenarios.
Options Opportunity
If available, consider looking into call options around 67,000 USDT strike price for short-term gains, and protective puts below 65,000 USDT to hedge against potential downturns.
This analysis is for informational purposes only and should not be considered financial advice. Always consult with a financial advisor before making any investment decisions. Trading cryptocurrencies carries a high level of risk and may not be suitable for all investors. Ensure you fully understand the risks involved and seek independent advice if necessary.


