Last Updated on June 12, 2024 by COINBUZZFEED
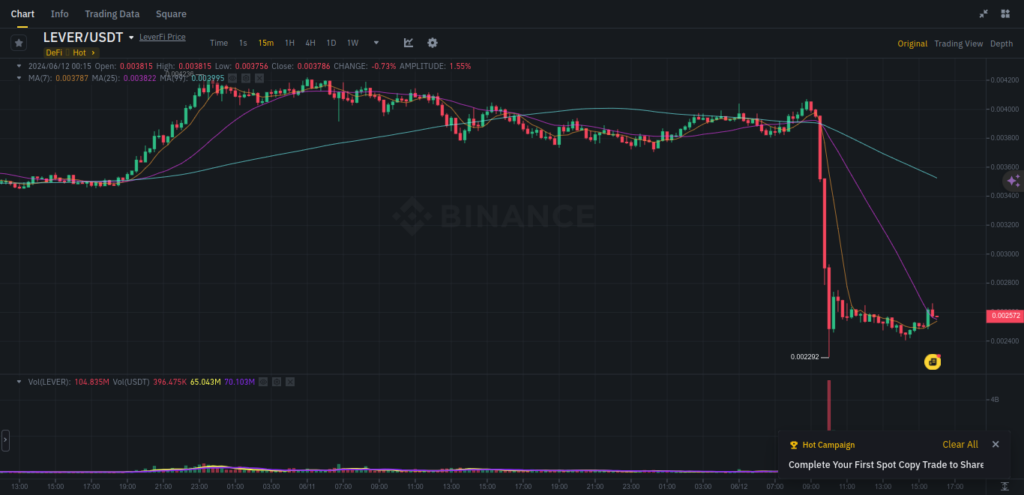
Cryptocurrency trading can be a wild ride, and the recent plunge in the price of LEVER/USDT is a perfect example. If you’ve been tracking this pair, you’ve likely noticed the significant drop in price, which has left many traders scratching their heads. Let’s break down the technical aspects of this drop and explore what might have caused it.
Overview of the Chart
First, let’s take a look at the chart setup and what it tells us:
- Timeframe: The chart is set on a 15-minute interval, offering a short-term perspective on the price movements. This timeframe is great for spotting quick changes and short-term trends, but it can also be quite volatile.
- Price Action: The price of LEVER dropped dramatically from around $0.00375 to a low of $0.002292. This sharp decline represents a significant loss in value, which is enough to unsettle even seasoned traders.
- Volume: There was a notable spike in trading volume during this price drop, indicating a high level of selling activity. When volume increases during a price decline, it’s a clear sign that many traders are looking to exit their positions.
Key Technical Indicators
Next, we need to examine the technical indicators that are often used to analyze price movements:
- Moving Averages:
- MA(7): The 7-period moving average, represented by the orange line, shows a steep decline. This indicates that there is short-term bearish momentum in play.
- MA(25): The 25-period moving average, marked by the purple line, is also trending downward. This confirms that the bearish trend is not just a short-term blip but is affecting the medium-term outlook as well.
- MA(99): The 99-period moving average, shown with a light blue line, remains relatively stable but is beginning to trend downwards. This suggests that even the longer-term sentiment is starting to shift towards bearishness.
Analysis of the Drop
To understand the reasons behind this drop, we need to delve deeper into the market dynamics:
- Volume Spike: The sudden increase in volume during the drop suggests panic selling or a significant event that triggered a mass sell-off. When traders see a rapid decline, they often rush to sell to avoid further losses, which can exacerbate the situation.
- Support Level: The price found temporary support around the $0.002292 level. This level saw increased volume, indicating that some traders saw this price as an attractive entry point or a level to cover their shorts.
- Resistance Level: Following the drop, the price has struggled to recover and faces resistance around the $0.002572 level. This was previously a support level but has now turned into resistance, a common occurrence in technical analysis.
Potential Causes of the Drop
Several factors could have contributed to the sudden decline in LEVER’s price:
- Whale Activity: Large sell orders by major holders, often referred to as “whales,” can cause significant price drops. In less liquid markets, a few big players can have a disproportionate impact on price.
- Technical Breakdown: The price may have broken through a key technical support level, triggering stop-loss orders and accelerating the decline. Once a critical support level is breached, automated trading systems and panic selling can drive the price down quickly.
Moving Forward
So, what should traders do in the wake of such a drop? Here are a few strategies to consider:
- Watch for Recovery Signals: Keep an eye on the price action for signs of recovery. This could include a sustained move above the short-term moving averages and an increase in buying volume. These signals might indicate that the market is stabilizing.
- Key Levels to Watch:
- Support: The recent low at $0.002292 is a critical level to watch. If the price falls below this, it could indicate further declines.
- Resistance: The $0.002572 level, which was previously support, now acts as resistance. Additionally, the psychological level of $0.0030 could also be a significant hurdle for any recovery attempts.
- Risk Management: Given the volatility, it’s crucial to implement risk management strategies. Consider using stop-loss orders to protect against further declines and adjust your position sizing to ensure you can weather the volatility.
The recent drop in LEVER/USDT is a classic example of how quickly things can change in the cryptocurrency market. The significant price decline, coupled with high trading volume, suggests strong selling pressure and a shift in market sentiment. Traders should stay vigilant, monitor key support and resistance levels, and be prepared to adjust their strategies based on the evolving market conditions.


