SUN/USDT Price Surge: Bullish Indicators Signal Continued Uptrend
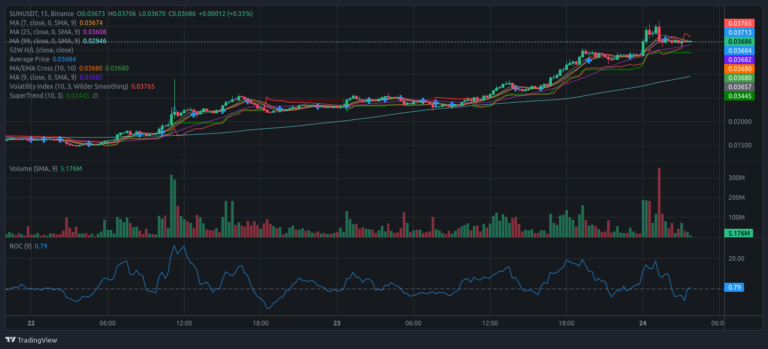
In the fast-paced world of cryptocurrency trading, the SUN/USDT pair on Binance has captured attention with its recent bullish momentum. Analyzing the 15-minute time frame chart reveals several key indicators that suggest a continued uptrend for this digital asset.
Key Technical Indicators
1. Moving Averages (MAs):
The analysis of moving averages provides a clear bullish signal. The 7-period MA stands at 0.03673, the 25-period MA at 0.03608, and the 99-period MA at 0.02946. With the shorter-term MAs positioned above the longer-term MA, the chart indicates a strong bullish trend. This alignment suggests that the SUN/USDT pair is experiencing upward price pressure.
2. Volatility Index (10, 3, Wilder Smoothing):
The current Volatility Index value is 0.03765, indicating higher volatility. Increased volatility often leads to significant price movements, which could further amplify the current bullish trend.
3. SuperTrend Indicator:
The SuperTrend indicator, set at 0.03445, is positioned below the current price, providing support and reinforcing the bullish outlook. This technical tool is used to identify the current trend and potential reversals, and its current position suggests that the uptrend is likely to persist.
4. Rate of Change (ROC):
The Rate of Change (ROC) indicator, with a value of 0.79, points to positive upward momentum. A positive ROC value typically signals that the asset’s price is increasing, adding further confidence to the bullish trend observed.
5. Trading Volume:
Volume analysis shows spikes in trading activity, which often precedes significant price movements. Increased volume supports the strength of the current trend and could be a sign of continued bullish activity.
Market Outlook
Based on the technical indicators, the SUN/USDT pair appears to be on a bullish trajectory. The alignment of moving averages, coupled with the supportive SuperTrend and positive ROC, suggests that the price is likely to continue its upward momentum in the short term. However, traders should remain vigilant for any significant changes in trading volume or price movements that could alter the current trend.
Prediction: If the price remains above the key moving averages and SuperTrend support levels, the bullish trend is expected to persist. Traders should monitor these indicators closely to gauge future price movements.
Disclaimer: This article provides an analysis based on technical indicators and market trends. It does not constitute financial advice. Traders should conduct their own research and consider consulting a financial advisor before making trading decisions.