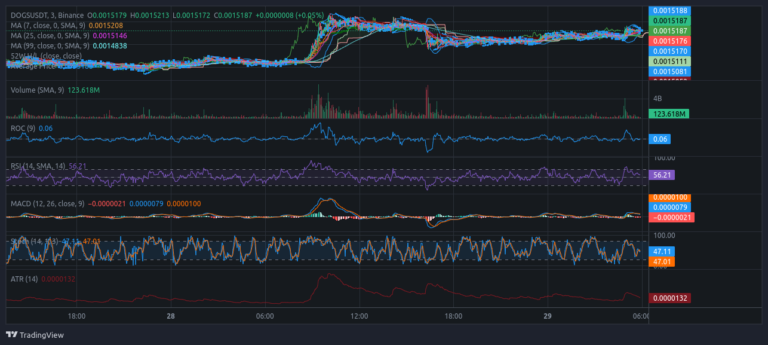
- $DOGS is currently trading at 0.0015187 USDT.
- Price is slightly below the 7-period moving average, indicating a short-term pullback.
- The Relative Strength Index (RSI) shows no overbought or oversold conditions.
- Low volatility suggests limited short-term price swings.
In the dynamic world of cryptocurrency trading, $DOGS is capturing attention with its latest price movements on Binance. As of the latest update, $DOGS is trading at 0.0015187 USDT, showing intriguing patterns on the 3-minute interval chart. This analysis delves into the current trends, moving averages, and key indicators that traders should watch closely.
Moving Averages and Trends
The price of $DOGS is currently above the 25-period and 99-period moving averages but slightly below the 7-period moving average. Specifically, the 7-period MA is at 0.0015208, the 25-period MA is at 0.0015146, and the 99-period MA sits at 0.0014838. The fact that $DOGS is trading above the 25-period and 99-period MAs indicates an overall bullish trend. However, the slight dip below the 7-period MA suggests a short-term pullback.
Volume and Market Interest
The 9-period simple moving average (SMA) for volume is at 123.618M, highlighting significant trading interest. High trading volume typically supports price movements, potentially indicating that more traders are eyeing $DOGS for its recent activity.
Key Indicators
Several indicators provide further insight into $DOGS’s market behavior:
- Rate of Change (ROC) (9): The ROC is slightly positive at 0.06, indicating modest upward momentum. This shows that the price is gradually increasing, although not aggressively.
- Relative Strength Index (RSI) (14): The RSI stands at 56.21, placing it in the neutral zone. This implies that $DOGS is neither overbought nor oversold, offering room for movement in either direction without imminent correction pressures.
- MACD (12, 26, 9): The MACD line is at 0.0000079, the signal line at -0.0000021, and the histogram at 0.0000100. The slightly positive histogram indicates a weak bullish signal, though the small magnitude suggests limited strength in the momentum.
- Stochastic Oscillator (14, 3, 1): Both the K% (47.11) and D% (47.01) lines are near the midpoint, suggesting a lack of clear momentum. This neutrality aligns with the RSI’s indication of no overbought or oversold conditions.
- Average True Range (ATR) (14): The ATR is at a low 0.0000132, indicating low volatility. This suggests that $DOGS might not see large price swings in the short term, providing a relatively stable trading environment.
Support and Resistance Levels
Understanding support and resistance levels is crucial for traders. Currently, $DOGS faces immediate resistance between 0.0015188 and 0.0015208, around the 7-period moving average. On the flip side, strong support is identified at 0.0014838, where the 99-period moving average is positioned. These levels will be critical in determining $DOGS’s next move.
Summary
The $DOGS/USDT pair on Binance shows a neutral to slightly bullish trend, supported by key moving averages and market indicators. While the price remains above the 25-period and 99-period MAs, the slight dip below the 7-period MA hints at a short-term pullback. With a neutral RSI and low ATR, traders can expect limited short-term volatility. Monitoring the support at 0.0014838 and resistance near 0.0015208 will be essential for anticipating $DOGS’s future price movements.