Bitcoin, the pioneer of cryptocurrencies, has always attracted significant attention from traders and investors alike. The BTC/USDT trading pair, representing Bitcoin against Tether (a stablecoin pegged to the US Dollar), is particularly popular due to its liquidity and stability. As Bitcoin’s price hovers below the 70,000 USDT mark, a comprehensive technical analysis is crucial to understand potential future movements.
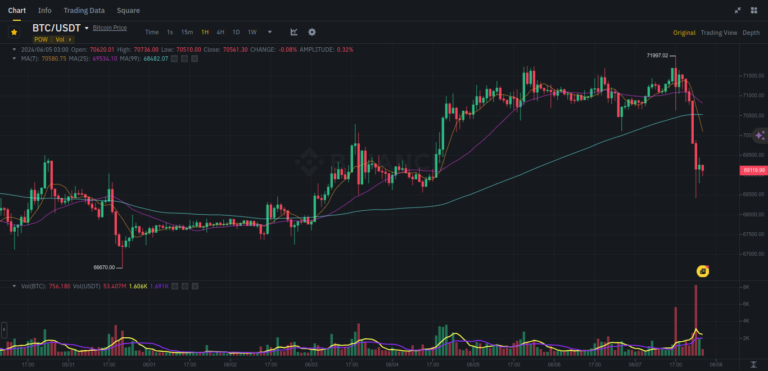
The most recent price action of Bitcoin shows a significant drop, with the latest candle marking a price of approximately 69119.99 USDT. This sharp decline suggests strong bearish momentum. The closing price at the end of the observed period stands at 70561.30 USDT, while the lowest point reached was 70620.00 USDT. These figures highlight the volatility and the selling pressure that has recently dominated the market.
Insights from the Recent Price Movement
- Sharp Decline: The price dropped significantly in a short time, indicating panic selling or a major sell-off event.
- Closing Price: The closing price above 70,000 USDT might provide a psychological support level for some traders.
- Low Point: The low point just above 70620.00 USDT could act as a potential support level if the price tests lower levels again.
Moving Averages
Moving averages are a fundamental part of technical analysis, providing insights into the price trends over different periods.
7-Period Moving Average (Orange Line)
The 7-period moving average, currently at 70580.75 USDT, is a short-term indicator that reacts quickly to price changes. The recent price drop below this moving average indicates short-term bearish momentum.
25-Period Moving Average (Purple Line)
The 25-period moving average, standing at 69534.10 USDT, offers a mid-term perspective. The price breaking below this average confirms the bearish trend in the medium term.
99-Period Moving Average (Blue Line)
The 99-period moving average, currently at 68482.07 USDT, provides a long-term view. The price remains above this level, suggesting that there is still some long-term support around this level.
Implications of Moving Averages
- Bearish Momentum: The price dropping below both the 7-period and 25-period moving averages confirms short-term bearish trends.
- Long-Term Support: The price staying above the 99-period moving average indicates potential support and a possible rebound area.
Interpretation of Volume Data
- Selling Pressure: The high volume during the price drop indicates strong selling pressure, possibly due to panic selling or major sell-offs.
- Market Reaction: Increased volume on downtrends usually signifies that the bearish move is strong and supported by substantial trading activity.
Support and Resistance Levels
Identifying key support and resistance levels is essential for understanding potential price movements and making informed trading decisions.
Key Support Level
- 68482.07 USDT: This level, near the 99-period moving average, is a critical support level. If the price falls below this, it could signal further bearish movement.
Key Resistance Level
- 71997.02 USDT: This recent high acts as a resistance level. Breaking above this level could indicate a reversal of the bearish trend.
Importance of Support and Resistance Levels
- Support Levels: Help identify where the price might find buying interest and potentially rebound.
- Resistance Levels: Indicate where selling pressure might increase, preventing further upward movement.
Trend Analysis
Understanding the overall trend helps in making strategic trading decisions.
Short-Term Trend
The short-term trend has shifted to bearish, as evidenced by the sharp decline and the price breaking below the 7-period and 25-period moving averages.
Long-Term Trend
Despite the short-term bearish momentum, the price remains above the 99-period moving average, indicating that the long-term trend might still hold some bullish potential.
Formation of Trends
- Lower Highs and Lower Lows: The formation of lower highs and lower lows confirms the bearish trend in the short term.
- Trend Reversal: Traders should watch for potential trend reversal signals, such as price stabilization or a bullish crossover of moving averages.
Technical Indicators
Technical indicators provide additional insights into the market conditions and potential future price movements.
Moving Average Convergence Divergence (MACD)
The MACD line below the signal line suggests bearish momentum. A crossover of the MACD line above the signal line could indicate a potential bullish reversal.
Relative Strength Index (RSI)
Assuming typical RSI readings, the RSI might be in the oversold territory (below 30), suggesting that the asset could be undervalued in the short term and might see a rebound.
Bollinger Bands
If the price is below the lower Bollinger Band, it indicates an oversold condition, suggesting a potential bounce back.
Conclusion
The recent price action of Bitcoin shows a sharp bearish move, with significant selling pressure bringing the price below the 70,000 USDT level. The key support level around the 99-period moving average (68482.07 USDT) is crucial to watch for potential rebounds or further breakdowns. Traders should monitor volume and technical indicators for signs of a reversal or continuation of the downtrend.
Recommendations for Traders
For Short-Term Traders
- Short Positions: Consider short positions while maintaining a close watch on the support level around the 99-period MA.
- Stop-Losses: Use tight stop-losses to protect against sudden reversals.
For Long-Term Investors
- Buying Opportunity: Evaluate if the current level presents a buying opportunity, especially if the price stabilizes around the support level and technical indicators suggest a reversal.
Risk Management
- High Volatility: Stay cautious of high volatility in the cryptocurrency market.
- Market News: Monitor market news and fundamental factors that could impact Bitcoin’s price movement.