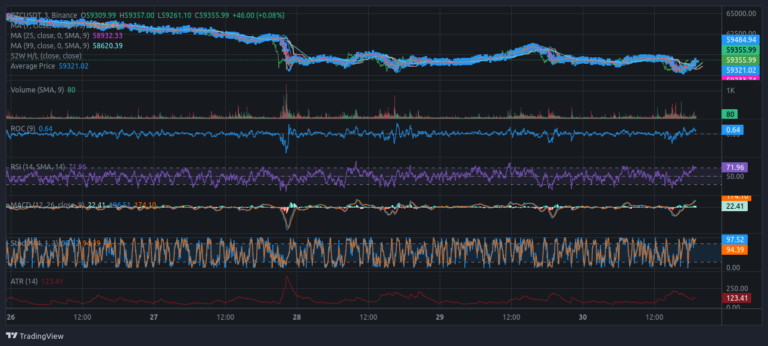
- Bitcoin price is hovering around $59,355 with slight gains.
- Technical indicators suggest Bitcoin is nearing overbought territory.
- RSI and Stochastic RSI indicate potential for a short-term correction.
- Long-term outlook remains cautiously bullish despite current volatility.
Bitcoin’s price movement shows an interesting tug-of-war between bulls and bears as it approaches the significant $60K level. The current price stands at $59,355, marking a slight increase of $46, or +0.08%, within the trading range of $58,620 to $59,484. However, the technical indicators are flashing signals that might dampen the spirits of the bullish traders.
Overbought Indicators Signal Caution
One of the key indicators, the Relative Strength Index (RSI), is currently at 71.96, indicating that Bitcoin is entering overbought territory. Generally, an RSI above 70 suggests that an asset may be overbought and could be due for a correction. This is further supported by the Stochastic RSI, which sits at a high of 94.39, reinforcing the possibility of a short-term pullback.
These overbought conditions suggest that the recent upward momentum might be losing steam. The Rate of Change (ROC) at 0.64 reflects positive momentum, but it’s not strong enough to suggest a significant price breakout.
Moving Averages and Market Momentum
Bitcoin’s Moving Averages (MA) offer further insight into its price trajectory. The 25-day MA is currently at $58,923.33, while the 99-day MA stands at $58,620.39. With Bitcoin’s price sitting just above these averages, it aligns closely with the 52-week average price of $59,321.02. This proximity suggests that Bitcoin is in a consolidation phase, where the price is hovering around its average, indicating a balanced market with no extreme bullish or bearish bias.
The Moving Average Convergence Divergence (MACD) shows a slight bullish crossover, yet the momentum isn’t strong enough to indicate a major upward movement. This further supports the notion of cautious optimism among traders, with the possibility of a consolidation phase before any significant price action.
Trading Volume and Volatility
The trading volume, while showing modest activity, does not suggest a strong influx of buying or selling pressure. Volume spikes are mainly observed during price dips, hinting at reactive trading rather than sustained market sentiment. The Average True Range (ATR), a measure of volatility, is at 123.41, indicating moderate volatility that is typical for Bitcoin, though not extreme.
Short-Term vs. Long-Term Outlook
In the short term, the indicators suggest a slightly bearish outlook due to overbought conditions. Traders should watch for a potential pullback, as the current momentum might not be strong enough to sustain the price above $60K without a correction.
However, the long-term outlook remains cautiously bullish. Bitcoin’s alignment with its moving averages and the moderate volatility suggest that after a potential short-term correction or consolidation, there could be room for further gains. The market appears to be in a wait-and-see mode, with cautious optimism prevailing.
Outlook: Slightly bearish in the short term due to overbought indicators, with a potential pullback likely. Long-term sentiment remains cautiously bullish, with traders advised to monitor the market closely.