- Trend Identification
- Overall Trend: Recent pattern shows a downtrend.
- Initial Phase: Uptrend followed by downtrends and recoveries.
- Current Phase: Lower highs and lower lows indicate bearish movement.
- Support and Resistance Levels
- Support Levels:
- Around 61500 (from moving averages and previous lows).
- 61800 (from multiple moving average indicators).
- Resistance Levels:
- Around 63300 (indicated by SuperTrend and previous highs).
- Moving Averages (MAs)
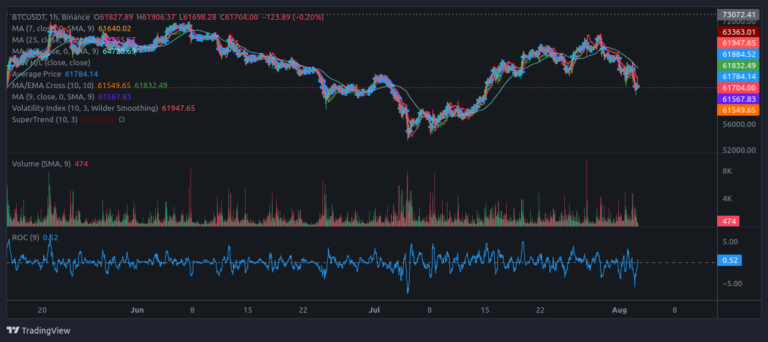
- MA (7, close): 61640, suggesting a near-term bearish trend.
- MA (25, close): 62284, showing bearish crossover points.
- MA (100, close): 64855, acting as long-term resistance.
- Indicators
- Volume (SMA, 9): Low, indicating reduced trading activity.
- Rate of Change (ROC, 9): 0.52, minimal momentum, suggesting indecision.
Trend Analysis
Current Market Sentiment: Bearish
Bitcoin’s chart shows a strong bearish sentiment with lower highs and lower lows. The initial uptrend gave way to a series of downtrends interspersed with short-term recoveries. This fluctuating pattern has recently settled into a more defined downtrend.
Key Support Levels
- 61500: This level has shown resilience, bolstered by moving averages and previous lows.
- 61800: Multiple moving averages suggest this as another critical support zone.
Key Resistance Levels
- 63300: The SuperTrend indicator and historical highs mark this level as significant resistance. A break above this could signal a reversal.
Moving Averages and Indicators
Moving Averages (MAs) Analysis
- MA (7, close): At 61640, this short-term MA indicates a bearish trend.
- MA (25, close): At 62284, highlights bearish crossover points, reinforcing the downtrend.
- MA (100, close): At 64855, serves as a long-term resistance level, a considerable gap from the current price.
Volume and Momentum Indicators
- Volume (SMA, 9): Low trading volume suggests a lack of conviction among traders, pointing to possible consolidation.
- Rate of Change (ROC, 9): At 0.52, the ROC indicates minimal momentum, reflecting a market in a state of indecision.
Candlestick Patterns and Volatility
Candlestick Analysis
- Recent Candles: Display bearish patterns with long upper wicks, indicating strong selling pressure.
- Historical Patterns: Periods of consolidation followed by sharp movements suggest potential for breakouts from these zones.
Volatility Index
- Volatility Index (10, 3): Currently at 61947, indicates moderate volatility. This level suggests the possibility of sudden price movements, adding to market uncertainty.
SuperTrend Indicator
- SuperTrend (10, 3): At 63363, marks a critical resistance level. A movement above this could signal a trend reversal and a shift to bullish sentiment.
Summary and Outlook
- Current Trend: Bitcoin is in a bearish phase, with recent lower highs and lower lows.
- Support Levels: Key supports are at 61500 and 61800.
- Resistance Levels: Significant resistance at 63300.
- Indicators: Low volume and ROC suggest a period of low momentum and potential consolidation.
- Volatility: Moderate, be prepared for sudden price movements.
Bitcoin’s current technical analysis shows a strong bearish trend with critical support and resistance levels. Traders should monitor these key levels, particularly 63300, for potential breakouts or breakdowns to gauge future price action.