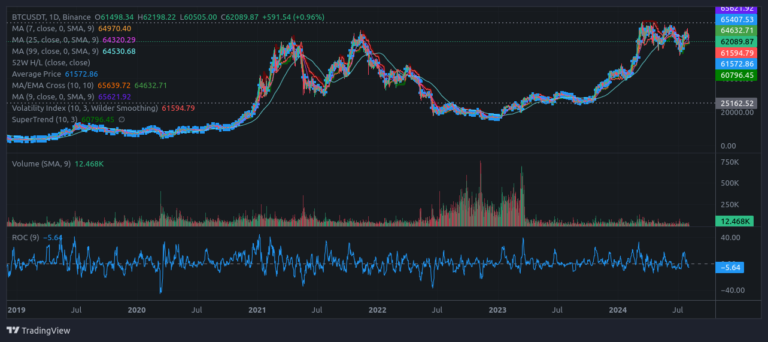
- Bitcoin’s price hovers around $62,000 after a recent dip.
- Significant whale movements suggest potential market shifts.
- Concerns persist about a possible drop below $60,000.
- Analysts observe key technical indicators and patterns.
Whale Activity Signals Potential Market Shift
Bitcoin (BTC) is making headlines again with its price stabilizing around $62,000 following a recent decline. This modest rebound comes amid notable movements from Bitcoin whales, who are shifting large amounts of BTC off exchanges. Such activity often hints at significant market changes ahead.
Technical Indicators Point to Mixed Signals
Moving Averages:
The current Bitcoin price slightly exceeds the 50-day moving average, suggesting a short-term bullish trend. However, it remains below the 200-day moving average, which indicates a longer-term bearish outlook.
Relative Strength Index (RSI):
The RSI hovers around 50, showing neither overbought nor oversold conditions. A slight move in either direction could signal a more defined trend, potentially indicating either a continued rise or a fresh decline.
MACD:
The Moving Average Convergence Divergence (MACD) indicator is showing a potential bullish crossover. If this crossover is confirmed, it could suggest a bullish reversal, encouraging more traders to enter the market.
Chart Patterns and Market Sentiment
Inverse Head and Shoulders:
Analysts are observing a potential inverse head and shoulders pattern forming on Bitcoin’s charts. This pattern is typically considered a bullish reversal signal, indicating the possibility of an upward price movement.
Support and Resistance Levels:
Bitcoin has strong support around the $60,000 mark, which is crucial for maintaining its current price level. The resistance near $64,000 is the next hurdle. A breakout above this resistance could confirm a bullish reversal and pave the way for further gains.
Whale Activity:
The recent increase in whale activity, with significant amounts of BTC being moved off exchanges, is often a precursor to major price movements. This behavior suggests that large holders are preparing for a potential price shift, possibly in anticipation of market volatility.
Market News and Sentiment:
Recent legislative discussions about Bitcoin reserves and broader macroeconomic factors are also playing a role in shaping market sentiment. These developments can have a substantial impact on Bitcoin’s price movements as traders react to potential regulatory changes and economic shifts.
Short-term Bitcoin Forecast
Considering the current technical indicators, chart patterns, and whale activity, there is a moderate probability that Bitcoin might experience a short-term bullish reversal. Sustaining above the $60,000 support level and breaking through the $64,000 resistance level would be critical for confirming this trend.
While these signs point towards a possible upward movement, traders remain cautious. The market’s volatility means that Bitcoin could still face downward pressure, especially if it fails to break key resistance levels or if market sentiment shifts negatively.
For investors, it’s essential to stay informed and monitor these indicators closely. The crypto market is notoriously unpredictable, and while the signs currently suggest a potential bullish trend, the landscape can change rapidly.
Disclaimer: This analysis is not financial advice. Always conduct your own research and consult with a professional financial advisor before making any investment decisions


