
2024 seems to contradict historical trends. The rather weak September was strong this year, and October, which is considered the strongest, is still weak. The price of Bitcoin has been in a narrow range since the end of February, which is now also confirmed by technical indicators.
Bitcoin is sideways between the 50- and 200-day moving averages as volatility in the bond market spiked. Chinese shares are down an average of 10-15% on Wednesday’s trading day after last week’s launch.
The price of Bitcoin is trapped
At the time of writing our article, Bitcoin

BTC Price
(BTC) is hovering around $62,400. The digital asset has been sluggish in recent days, and its trading volume has also fallen compared to the average. The passivity is also confirmed by the width of the Bollinger bands. The technical indicator fell to a level not seen since mid-June.
The analytical tool for measuring volatility can easily explode after a low range, which would not surprise the market now either, since the Bitcoin exchange rate returned to the 50- and 200-day simple moving average in September, and has not been able to break out of it for a long time.
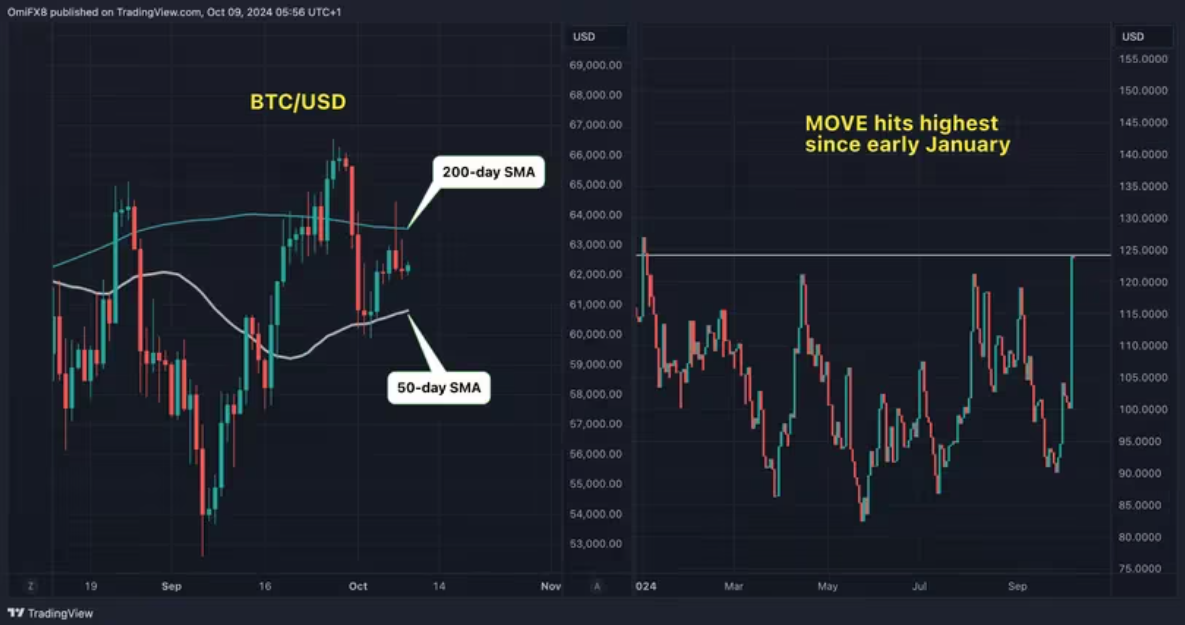
Evolution of Bitcoin moving averages and the MOVE indicator, source: TradingView
On the one hand, due to the expected and hoped-for rise in October, and on the other hand, due to the jump in the MOVE index, we may soon face real volatility. The indicator measuring the expected volatility of US Treasury bonds rose 24% on Monday, reaching its highest value since the beginning of January.
The dollar may strengthen further
After August, the US Dollar Index (DXY) is again above the 102.5 level. The index, which measures the strength of the US dollar, began to rise significantly in response to last week’s events in the Middle East, outperforming all rival currencies around the world.
The increased volatility of Treasury bonds, which play a prominent role in global hedging and financing, can often lead to financial tightening – which the Federal Reserve interest rate reduction strategy because of this, it is not very viable now – or for risk avoidance. The situation also benefits the US dollar as it can potentially outperform riskier assets.
According to ING, the dollar index may even reach a level of 103 points by the end of the month. Despite this, the leading US indices also performed well in recent days. The S&P 500 ended Tuesday with a rise of 1%, the Nasdaq 100 by 1.5%, and the Dow Jones Industrial Average by 0.3%.
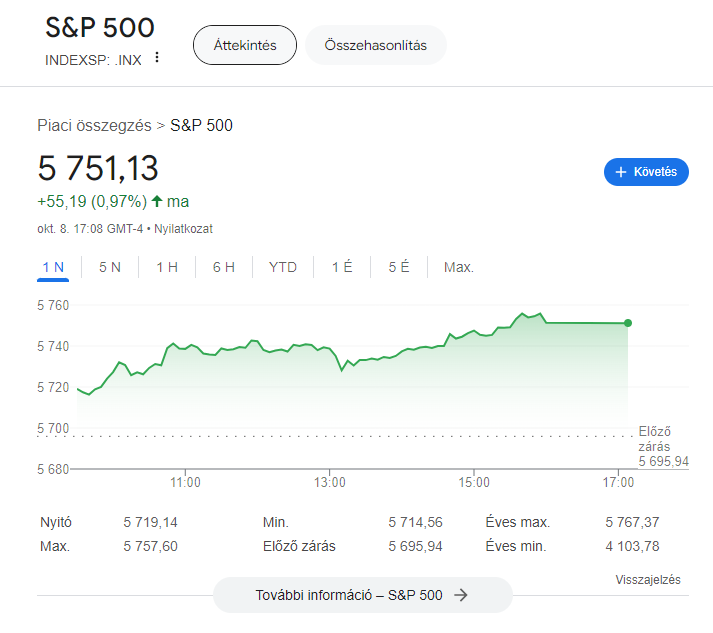
Evolution of the S&P 500, source: Google Finance
At the time of writing, the S&P 500 is above 5,750 points.
Chinese stocks are plummeting
The ten-day soaring of the Chinese stock market has come to an end. Behind the incredible rise seen last week was likely fiscal stimulus, which appears to be lagging behind. At the end of September, Beijing announced a series of incentives that drove up indices and stocks against cryptocurrencies, among others.
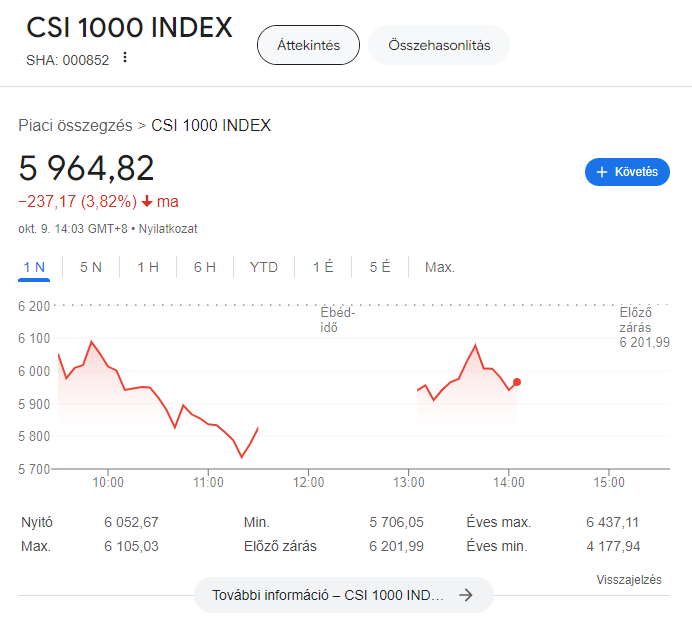
Evolution of the CSI 1000 Index, source: Google Finance
The market reacted clearly to the lack of fiscal stimulus. Of the Chinese indices 5% drop also produced CSI 100, Shanghai, SZSE Component, China A50 and SSE 100. The situation for individual stocks is even more gloomy. Hebei Broadcasting is down 57%, Dongguan Changlian is down 42% and Intsig Information is down 40% after the lunch break.
Most shares are down around 15% on Wednesday morning European time. A reversal in the flow of money could cause capital to flow into alternative assets such as cryptocurrencies, which could also benefit Bitcoin, for example.