- Price Movement:
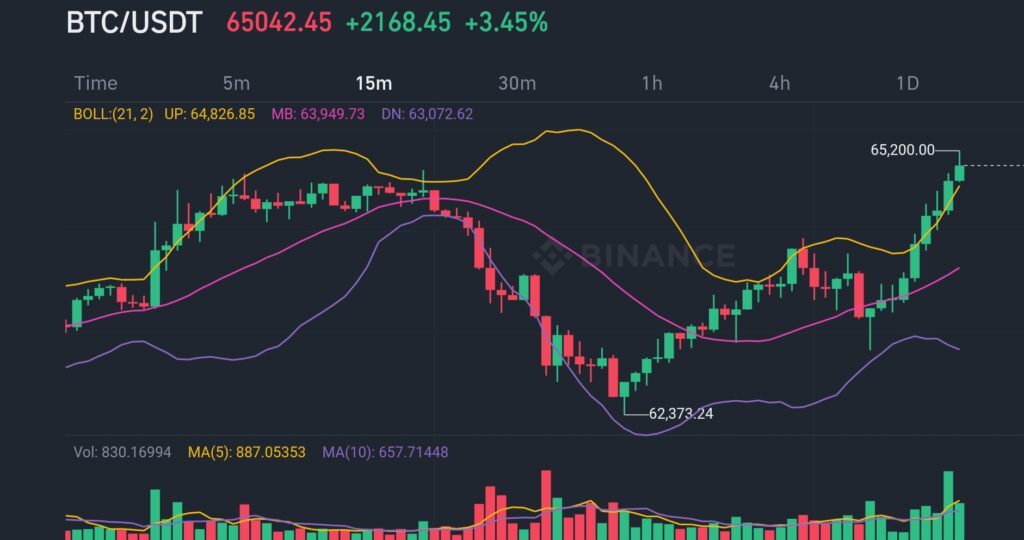
- Current price: 65,042.45 USDT.
- Recent price increase of 3.45%, indicating bullish momentum.
- Bollinger Bands:
- Upper band (UP): 64,826.85
- Middle band (MB): 63,949.73
- Lower band (DN): 63,072.62
- The price is above the upper Bollinger Band, suggesting the asset is overbought and there might be a potential pullback or continuation of the bullish trend if volume supports.
- Candlestick Patterns:
- Recent candles are predominantly green, showing buying pressure.
- The last few candles have higher highs and higher lows, which is a bullish sign.

Future Prediction
Bullish Indicators:
- The price breaking above the upper Bollinger Band.
- Short-term moving average crossing above the long-term moving average.
- Increased volume confirming the upward trend.
Potential Resistance Levels:
- The next resistance level is around 65,200.00, where the price previously faced resistance.
Support Levels:
- If the price retraces, support levels to watch are around the middle Bollinger Band (63,949.73) and the recent low of 62,373.24.
Conclusion
Bullish Outlook: The technical indicators suggest a bullish outlook for BTC/USDT. However, be cautious of potential overbought conditions as indicated by the price being above the upper Bollinger Band. Keep an eye on volume and any pullbacks to assess the strength of the trend.
Always consider external factors like market news and macroeconomic conditions in conjunction with technical analysis for making informed trading decisions.


