The latest data and analyze the current landscape for Ethereum (ETH). 📊
Ethereum (ETH)
- 🌟 Price: $3,845.05
- 📈 24h Change: +1.18%
- ⏳ 1h Change: +0.002%
- 📅 7d Change: +1.56%
- 📆 30d Change: +25.09%
- 🗓 60d Change: +12.81%
- 📉 90d Change: -3.50%
- 🏦 Market Cap: $461,979,401,349.10
- 💼 Market Cap Dominance: 17.44%
Ethereum is showing a consistent upward trend over the past month, though it’s seen a minor dip over the past quarter. With a significant market cap and volume, it’s clear ETH remains a heavyweight in the crypto space. Now, let’s integrate this with our 15-minute chart analysis to get a more granular view.
ETH/USDT 15-Minute Chart Analysis
Key Observations
1. Price Action:
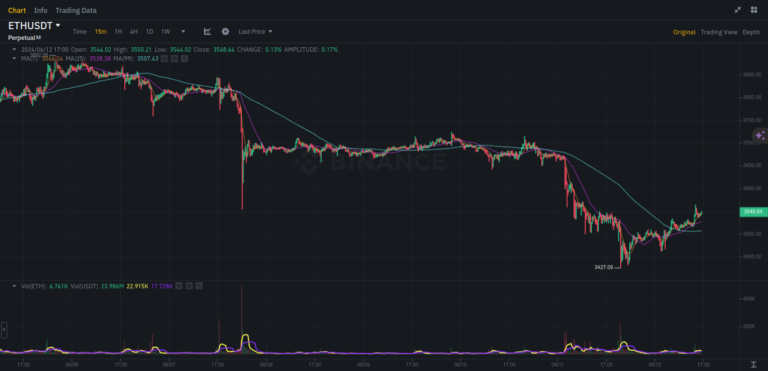
- Sharp Decline: On 06/07, ETH/USDT experienced a sharp drop from approximately 3750 to 3427.
- Consolidation Phase: Following the decline, the price entered a consolidation range between 3450 and 3550, lasting several days.
- Recent Movement: There’s been a recent uptick, with the price currently at 3548.64.
2. Moving Averages:
- Short-term MA: Likely a 20-period MA.
- Long-term MA: Likely a 50-period MA.
- Bearish Crossover: The short-term MA crossed below the long-term MA, signaling a bearish trend. However, recent price action shows a recovery with the price moving above the short-term MA.
3. Volume:
- High Volume Drop: Volume spikes during the sharp decline indicate strong selling pressure.
- Low Volume Consolidation: Volume decreased during the consolidation phase, suggesting reduced trading activity.
- Increased Volume on Uptrend: A slight increase in volume during the recent upward movement indicates buying interest.
Technical Indicators
- Support Level: Around 3427, where the price found a floor post-decline.
- Resistance Level: Near 3600, previously a support level before the sharp drop.
- Moving Averages: The shorter-term MA serves as a dynamic support/resistance level.
Bullish/Bearish Sentiment:
- Short-term Bullish: The price is recovering and trading above the shorter-term moving average.
- Caution Advised: The bearish crossover of moving averages suggests caution. A break above the 3600 resistance is needed to confirm a stronger bullish trend.
For Long Positions:
- Entry Point: Consider entering if the price sustains above 3550 with increased volume.
- Confirmation: Look for a break above the 3600 resistance to confirm a stronger bullish trend.
For Short Positions:
- Entry Point: Consider shorting if the price fails to break 3600 and shows signs of reversal.
- Bearish Momentum: A breakdown below the support level at 3427 would indicate further bearish momentum.